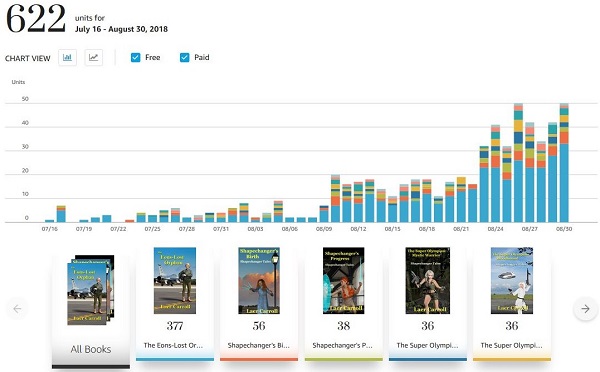
Amazon has a new reporting tool for our books which I'm finding very useful. Below is an example for the period in which I put up a new ebook, The Eons-Lost Orphan. Several items become evident when we look at it.
First, it started selling at a pace that I've come view as normal for my previous six books - a few each day.
Second, on August 9[SUP]th[/SUP] SOMETHING happened. The title started selling better, then better yet. By the end of the month the average per-day sales for my books was 40. (I've searched in vain the "something" for some very positive review or mention of my book which would explain its sudden popularity.)
Third, the sales of Orphan increased interest in my other books. Not by a lot. All together they sold about a third of what Orphan did. But that's still significant money to me.
Fourth, because the books are color coded we can see how many each of the books sells each day. Roughly, at a glance. Exactly, by holding our cursor over each column.
Lastly, if we look different reporting periods, such as the last 90 days, we can see trends. Two I identified was (1) after a couple of months of high sales the numbers began to drop as the market became saturated.
And (2) Orphan's sales were dropping faster than the other books. (Meaning to me that I'd better finish its sequel in this next month before interest in the series ceases altogether.)
